Most corporate ESG pages look alike: commitments, team photos, the vocabulary of intent. They cost nothing to write, and they convince nobody — least of all a buyer who has to justify their choice of supplier to their own management.
What has changed is that the question is no longer rhetorical. Large customers pass their reporting obligations down to their suppliers well before regulation reaches those suppliers directly. An ESG questionnaire now arrives with the tender, and it expects numbers.
Why this is reaching smaller firms now
The CSRD progressively widens the set of companies subject to sustainability reporting. Its timetable has been revised several times, and part of the originally targeted population has been delayed or removed — which has left many owner-managers with the impression that the subject has been postponed.
That reading is incomplete. The legal obligation has not reached small firms yet, but the contractual requirement already has. A company subject to reporting must document its value chain, so it questions its suppliers, whatever their size.
The real trigger
It is almost never the law that starts the project, it is a supplier questionnaire. The moment you discover you must produce numbers within three weeks is also the worst possible moment to start building a measurement system.
ESG page or dashboard: two different objects
The two are often confused. An ESG page tells a story to a reader; a dashboard publishes indicators to an assessor. They share neither content, nor update rhythm, nor audience.
| ESG page | Indicator dashboard | |
|---|---|---|
| Reader | Customer, candidate, public | Buyer, auditor, investor |
| Content | Commitments, approach, examples | Dated figures, scope, method |
| Updates | Annual or less | Quarterly or continuous |
| What makes it credible | Consistency with the facts | Traceability of the data |
| Typical cost | Writing only | Collection + aggregation + publishing |
Most companies only need the first, done properly. The dashboard earns its place when several customers ask for the same figures several times a year — at which point publishing once costs less than answering ten times.
The four things that make a figure credible
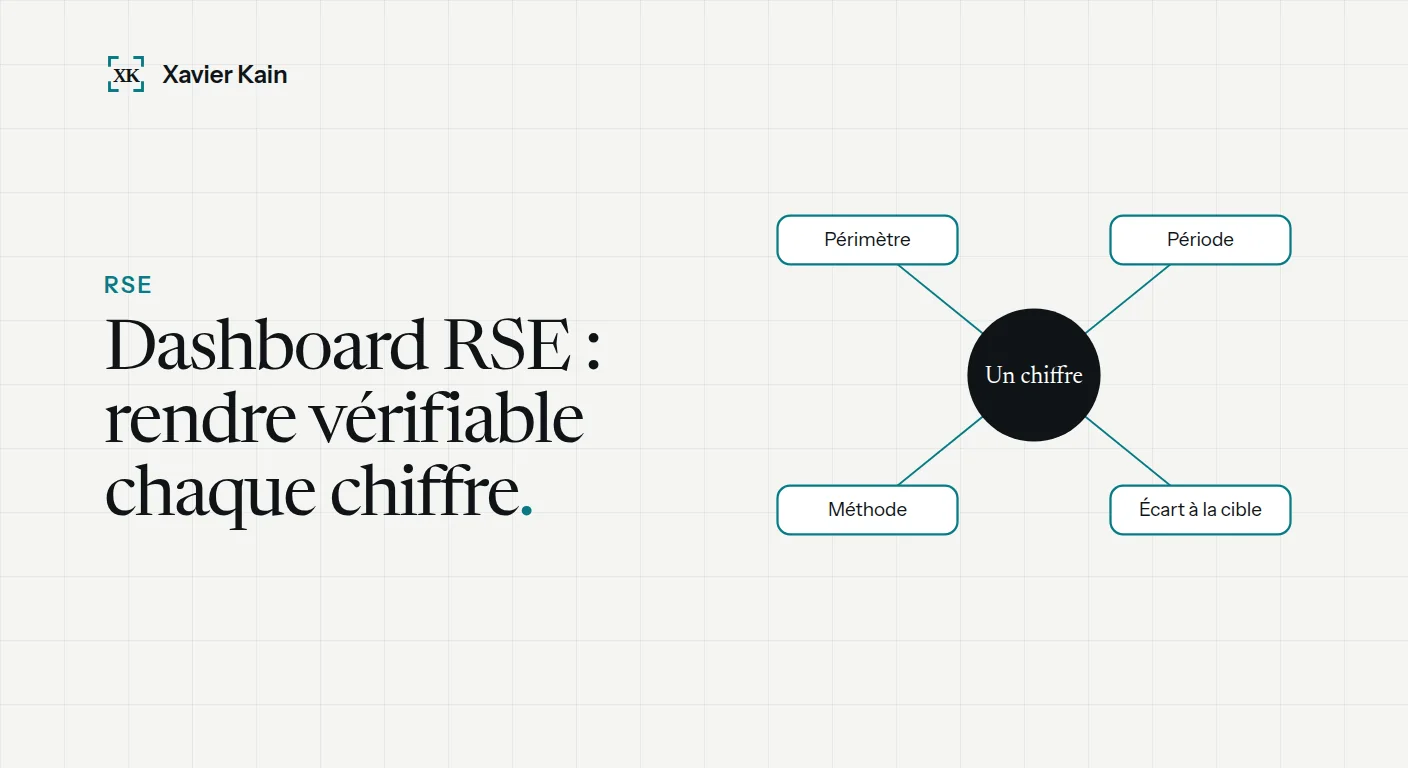
An indicator published without these four elements is treated as a claim, not as data. That holds for an auditor, and it holds for a search engine trying to identify a reliable source.
- Scope — which entities, which sites, what share of activity does the figure cover? A carbon footprint covering 40 % of the perimeter is not wrong, but it must say so.
- Date and period — a figure without a reference year cannot be used.
- Method — which emission factor, which database, which version. That is what makes year-on-year comparison possible.
- Gap to target — publishing a target without the actual, or the reverse, is the most recognisable marker of communications rather than reporting.
The sceptic's test
Show your ESG page to someone with no reason to believe you and ask what they could verify. If the answer is "nothing", the page is a brochure, however good the work behind it.
Scope 3, where it gets complicated
Direct emissions and purchased energy are measured from invoices. Indirect value-chain emissions — purchasing, transport, product use, travel — usually make up most of the total and have no single source.
That is where the question becomes an information-systems matter rather than a communications one. The data exists, but in the accounts, the ERP, expense claims and procurement spreadsheets. Assembling it once is a project; assembling it every quarter requires automation.
The common mistake is to start with the tool. The right sequence is the reverse: identify the five to ten indicators your customers actually ask for, find where each piece of data lives, and only then decide between an off-the-shelf platform, a disciplined spreadsheet or a custom dashboard.
CSRD in 2026: learn the mechanism, not the thresholds
The scope has been amended several times and is still moving. Learn the mechanism instead: the directive applies in successive waves, a "stop the clock" directive adopted in 2025 pushed the later waves back by two years, and the "omnibus" revision is debating a higher entry threshold. Check the law as it applies to your own financial year before deciding anything — this paragraph may be out of date by the time you read it.
| Your situation | What it means in practice |
|---|---|
| Large listed company, already in scope | Report published and assured; already questioning suppliers |
| Large unlisted company | Deadline pushed back, but collection to prepare now |
| Listed SME | Deferred, with a lighter standard under discussion |
| Unlisted SME, subcontractor | Never directly in scope, questioned by customers every year |
What does not move is the value-chain logic. A company in scope must document its purchasing and its indirect emissions; it has no way of doing that except by questioning its suppliers. EFRAG has published a lighter voluntary standard for SMEs precisely to bound those requests and stop every large customer inventing its own questionnaire.
So for a company of 30 to 200 people the operational question is not "am I in scope?" but "how many of my customers are, and what are they asking me for?". If three customers representing 40 % of revenue send a questionnaire once a year, this is already a commercial matter, whatever the current debates conclude.
Collection: the bottleneck sits upstream of the tool
On a first reporting cycle, the split of effort always surprises people. Collecting and cleaning the data takes 60 to 80 % of the time; calculation and presentation take the rest. Picking the tool before mapping the data is like buying a production line before deciding what you make.
| Indicator | Source | Automatable |
|---|---|---|
| Site energy consumption | Invoices, supplier portal | Yes, once meter points are identified |
| Scope 1 (fuel, gas) | Accounts, fuel cards | Yes, from accounting entries |
| Purchasing and upstream scope 3 | Purchase ledger, spend-based factors | Partly: the mapping stays manual |
| Business travel | Expense claims, travel agency | Yes if the agency exports, otherwise manual |
| Headcount, pay gap, training | HR system, payroll | Yes, monthly export |
| Supplier policy, governance | Internal documents | No: written once a year |
Mapping purchases is the hard part: every ledger line has to be attached to an emission category, and that work only becomes automatic after being done once by hand. Allow two to five days for an SME chart of accounts, then a few hours a year to keep the mapping table current.
The opposite excess is just as common: trying to automate everything in year one. An indicator produced once a year from two files justifies no integration at all. The useful rule fits in a sentence: automate what you will produce at least four times a year, and document the rest.
The audit trail: what an assurance provider looks at
Sustainability reporting by companies in scope is subject to assurance by an independent provider. Outside that obligation, large-company buyers apply the same grid: they do not argue with the value of the figure, they ask where it came from and what proves it has not changed since.
- The source data kept — the invoice, the raw export, not only the aggregated result
- The transformation chain — which calculation, which emission factor, which version of the database
- Timestamp and author — who entered or corrected what, and when
- Restatements — a figure corrected after publication must remain visible as a correction
- The stated scope and how it changed from one year to the next
That, more than any calculation limit, is what disqualifies the shared spreadsheet. A workbook three people write into with no history produces no audit trail: neither the original value nor its author can be recovered. A version-controlled spreadsheet, with a maintained "sources and methods" tab and an archived copy at each publication, is acceptable again for a first cycle.
Technically, traceability is cheap when designed in from the start: a history table, the original value kept alongside the corrected one, a source identifier per row. It becomes a project in its own right when bolted on two years later, over a history that has already been overwritten.
What a first reporting cycle really costs
Quotes vary by a factor of ten, and the gap is almost never in the visible part. Here is how the effort actually splits on a first cycle, for an industrial company of 80 to 150 people with a main site and two secondary ones.
| Item | Effort | Order of magnitude |
|---|---|---|
| Framing: indicators requested, scope | 3 to 5 days | £1,800 to £3,500 |
| Collection and data cleaning | 8 to 15 days | £4,500 to £10,000 |
| Calculation and emission factors | 2 to 4 days or a subscription | £1,300 to £5,000 a year |
| Custom online publication | 10 to 20 days | £7,000 to £22,000 |
| External assurance, where required | Auditor engagement | £4,500 to £18,000 |
Two lessons. Year one costs two to three times year two: most of the spend is setup, not a recurring charge. And if you do not publish online, the heaviest line in the table disappears — which is why it pays to check that publication actually serves you before committing to it.
The payback calculation comes down to one question: how many hours does your team spend filling in customer questionnaires? At four questionnaires a year and two days each, you are already at sixteen days of scattered work with nothing carried forward. Publishing once what ten customers keep asking for is the one case where the dashboard pays for itself.
Off-the-shelf software or a custom dashboard
Carbon accounting platforms handle standard calculation well and are paid by subscription. They fit when the need is to produce a footprint compliant with a known framework.
| Situation | Direction |
|---|---|
| First carbon footprint, standard framework | Off-the-shelf software |
| Data spread across several internal systems | Custom integration |
| A report to publish online in a specific form | Custom dashboard |
| Several entities with different perimeters | Custom or multi-entity platform |
| One-off need, once a year | A documented spreadsheet is enough |
Custom work is justified mainly by publication: software produces a report, it does not produce an indexable, citable web page integrated into your site. If the goal is for your figures to be found and quoted, this is a web project as much as a measurement one.
Key points
- Your customers' contractual requirement arrives before the legal obligation: that is what starts the project.
- A figure without scope, date and method is read as a claim.
- Collection is 60 to 80 % of the effort: map the data before choosing a tool.
- Automate what you will produce at least four times a year; document the rest by hand.
- Without a history of corrections there is no audit trail — and the shared spreadsheet fails there first.
- Start from the indicators actually requested, not from the choice of tool.
- Software produces a report; publishing findable, citable figures is separate work.
FAQ — ESG dashboards and reporting
Does the CSRD apply to my company?
Its scope and timetable have been revised several times since the directive was adopted: the answer depends on size, status and the financial year concerned, and you need to check the law as it currently applies to your situation. In practice the operational question is different: customers subject to reporting will ask you for data well before the obligation reaches you directly.
What does a custom ESG dashboard cost?
Between £7,000 and £22,000 depending on how many data sources must be connected. The cost sits in integration, not display: wiring up an accounting system and an ERP is most of the work, visualisation is a small part of it.
Can you start with a spreadsheet?
Yes, and it is often the right first step. A documented spreadsheet — scope, sources and calculation method written down — beats a poorly fed tool. Moving to something automated makes sense when manual collection becomes the bottleneck.
Should figures be published openly?
Publishing commits you, and that is precisely what gives the gesture value. If you are not ready to publish a figure that has worsened, publish the method and scope first, and the figures the following year. A documented trajectory is more credible than an isolated number.
Which indicators should you start with from zero?
The ones your customers already ask for, in the terms they use. In practice: energy consumption and scope 1 and 2 emissions, headcount and workplace accident frequency rate, and the share of spend covered by a supplier code of conduct. Those four families cover most questionnaires an industrial subcontractor receives, and they are calculated from data you already hold.
How long does a first reporting cycle take?
Three to six calendar months, most of it spent waiting: the missing figure sits with a department that has other priorities. Actual working time is fifteen to twenty-five days spread across that period. Starting collection three weeks before a customer questionnaire deadline produces unsourced figures that will be challenged at the first review.
Sources
- European Commission — Corporate sustainability reporting — official CSRD scope and timetable
- GHG Protocol — Corporate Value Chain (Scope 3) Standard — scope 3 categories and method
- EFRAG — European Sustainability Reporting Standards — applicable reporting standards
Customers asking you for numbers?
Describe what you are being asked for and where your data lives. I'll tell you whether a spreadsheet is enough, whether an off-the-shelf tool fits, or whether integration is warranted — and what that involves.
Review my reporting